
Trade Smarter. Grow Faster
Introduction to Forex Trading
In our first course, you will be introduced to the world of Forex trading. You will learn what Forex trading is all about, why someone chooses to trade Forex, and what actually happens when you make a Forex trade.
We will take you from a simple explanation of how Forex works to the selection of the various currency pairs that make up Forex trades. We will discuss how currencies are listed on the Forex markets. What is the base currency and what is the quote currency? How do the global Forex markets interact?
We will also review the many reasons why someone might trade Forex rather than a different investment vehicle, and detail both the advantages and disadvantages of this type of trade.
This course will provide the background needed to understand our more advanced courses in Forex trading.
Fundamental Analysis
Fundamental analysis has much in common with methods of analyzing the real value of stocks and shares which seek to discover whether particular stocks are undervalued or overvalued. In this course, we will explain what fundamental analysis is, and how you can build and execute your own model to analyze different currencies within the market, using it to take a view as to which currencies are likely to rise or fall in value –even if you aren’t an expert economist!
Lesson 1 explains the concept of fundamental analysis in more detail.
Lesson 2 explains the major items of national economic data which need to be analyzed to build a fundamental view of a country’s economy and, by implication, its currency.
Lesson 3 explores the key role played by central banks in Forex fundamental analysis, explaining how to determine whether a central bank is pursuing a course which should tend to either weaken or strengthen its currency.
Lesson 4 concludes the course by bringing together all the threads with an explanation of how to apply the analysis for more profitable Forex trading. Using fundamental analysis can help improve any trader’s profitability and it isn’t as hard as is often assumed, so it’s worth giving it a try!
Scalping
At some point in your journey as a trader, you will come across the term “scalping”. What does it mean to scalp the market? How is it different from regular trading?
Scalping means taking very small bites out of the market, entering and exiting trades in only seconds or minutes at the most. It is a very precise way to extract profits from the market.
But with such speed and taking small numbers of pips, your trading will be different compared to longer-term traders. For example, spreads will have a higher impact on your profitability. You may be more restricted with the Forex pairs and times of day you choose to trade. You may even need to alter your computer setup to cope with the extra demands of Scalping.
In these lessons, we walk you through the exciting journey of scalping from the basics at the beginning to a complete scalping strategy at the end of the module.

Volatility
This course aims to ensure that you get an understanding of market volatility, how volatility is measured, and how to apply these measurements to your trading to find more profitable trade entries and ensure more successful trading with volatility trading. The course ends with a complete and rule-based volatility trading strategy.
Elliott Wave Theory: Principles, Patterns & Forex Trading Strategies
The theory that Ralph Elliott proposed was revolutionary in its time as it was one of the first concepts in the financial markets to recognize that prices do not move randomly. Elliott Wave Theory states that market price unfolds in specific trends and patterns. The theory attempts to define these trends so they can be predicted and traded profitability. In fact, Elliott himself made successful predictions using the theory in his lifetime. On one occasion, he predicted the low of the U.S. stock market in 1935 to within one trading day. The subsequent bull market lasted nearly 2 years and almost doubled the value of the Dow.
In this series of lessons, we are going to go through some of the most important Elliott Wave principles and we’ll look at how some of these are applied on real charts. You can use these lessons to start looking for Elliott Waves on charts and as a foundation for further study and Forex Elliott Wave analysis.

In Lesson 1 we begin by looking at the foundation of Elliott Wave and that is the Elliott Wave Sequence. This is where it all starts if you want to learn about Elliott Wave. From there, the theory breaks down the Sequence into its different types of Waves, primarily the Impulse Waves and the Corrective Waves.
In Lesson 2, we look at the rules discovered in Lesson 1 and apply them to real charts. We look at a bullish chart and a bearish chart and see if you can find where the Elliott Waves would be placed. This is great practice to make sure you have understood the main Elliott Wave principles.
In Lesson 3, we take a closer look at Corrective Waves. These are not traded as much by Elliott Wave practitioners, but they are very important to understand and spot to give you context of where the market is.
Ln Lesson 4, we look at how Fibonacci analysis can be applied to Elliott Wave theory. Forex Aspire has an entire module dedicated to Fibonacci, but here we look at how it is traded to find points on an Elliott Wave sequence. Lesson 4 begins with looking at Wave 3.
Lesson 5 continues the Fibonacci theme and this time looks at Wave 5 and its potential Fibonacci levels. Although Wave 5 is not as popular as Wave 3 to trade, it still provides opportunities to extract profits out of the market.
The Impulse Waves
In this lesson we discover main principles of Elliott Wave Theory and the rules that govern them. This is where you first learn about a full Elliott Wave Sequence and how it’s broken down into Impulse Waves and Corrective Waves! Impulse Waves are the most popular to trade and this Lesson covers 3 very important rules that govern all Impulse Waves.
Real Chart Examples
With the foundation built in Lesson 1, in Lesson 2 we look at two real charts, a bullish chart and a bearish chart, to see if you can identify Elliott Waves yourself. This is an important test in all learning – can you apply the ideas in a real trading scenario?
Corrective Waves
To get from one Impulse Wave to another Impulse Wave, there must be a Corrective Wave. Traders prefer Impulse Waves to trade because they are in line with the Elliott Wave Sequence or overall trend. Corrective Waves must be spotted to find the start of an Impulse Wave. Traders How do Corrective Waves work? What are the different types? Let’s find out in Lesson 3.
Trading Elliott Wave with Fibonacci Part 1
Fibonacci is a very useful tool in trading, and it is integral to modern Elliott Wave Theory. Wave 3 is by far the most popular Elliott Wave to trade. To help catch the beginning of Wave 3, traders use specific Fibonacci retracement percentages. Let’s find out how they do that in this lesson.
Trading Elliott Wave with Fibonacci Part 2
Wave 5 is the next most popular Elliott Wave to trade after Wave 3. Just like Wave 3, to help catch the beginning of Wave 5, traders use Fibonacci retracements. How is that done with Wave 5 compared to Wave 3? Let’s find out in this lesson and round off our Elliott Wave knowledge
Forex Breakouts
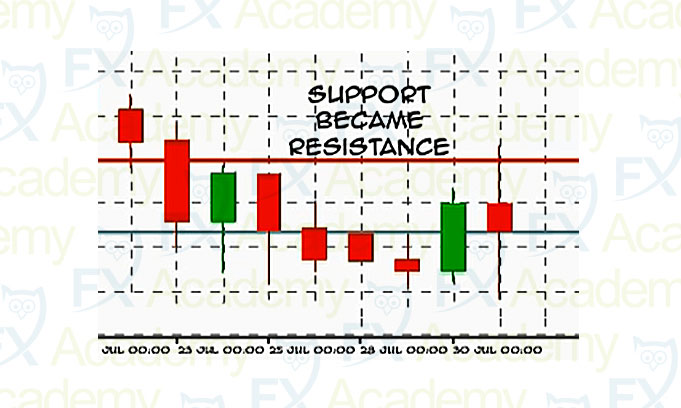
A breakout is what happens when the price of something pushes past a level it has not exceeded in a while. Breakouts are a key element of trading and have been a “bread and butter” tool of speculators for centuries. Academic research has shown that many of the strongest, most profitable technical trading “edges” set up just after major breakouts happen or fail. Learning to correctly identify breakout trading opportunities is a major step in becoming a profitable Forex trader, and our course on Breakouts will teach you how to find them and how to trade them. Breakouts can also be understood as the failure of support or resistance levels, so understanding breakouts may held you understand the concepts and real-world application of support and resistance also.
It is important to understand that not all breakouts are of equal importance. Breakouts of price ranges defined by shorter time frames have little statistical significance unless they are aligned with a longer-term breakout. In this course, we show that breakouts beyond at least 50-day high and low prices have tended to be meaningful when they happen in the major Forex currency pairs.
Breakouts are also often known as “momentum breakouts” or “volatility breakouts” when they are accompanied by unusually strong directional volume and/or momentum.

Applying SR and Candlesticks
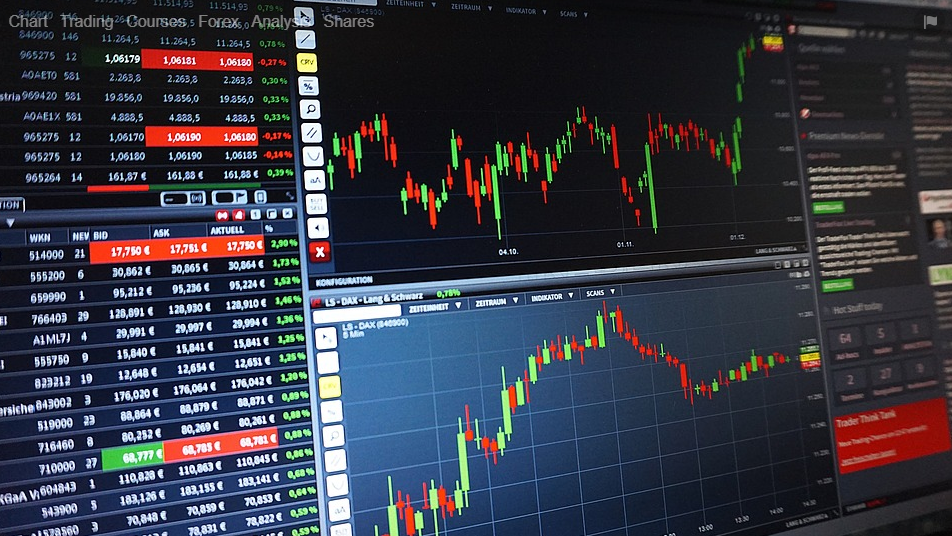
The lessons in Course #2 will teach you how to use Forex charts before placing your first trade. In order to understand price behavior, you will need to learn how to read and interpret charts. The focus will be on Japanese candlestick charts, which we will discuss more fully in later lessons.
Support and Resistance Basics
In this course, we introduce some basic technical analysis that helps a trader decide when to place a trade. We start off with how to determine reward/risk ratios prior to trade entry. We will discuss the concepts of support and resistance and what they mean to the trader. We will be introducing some simple charts which indicate the support and resistance levels of a particular currency pair. We will talk about entry and exit limit orders, as well as stop loss orders.
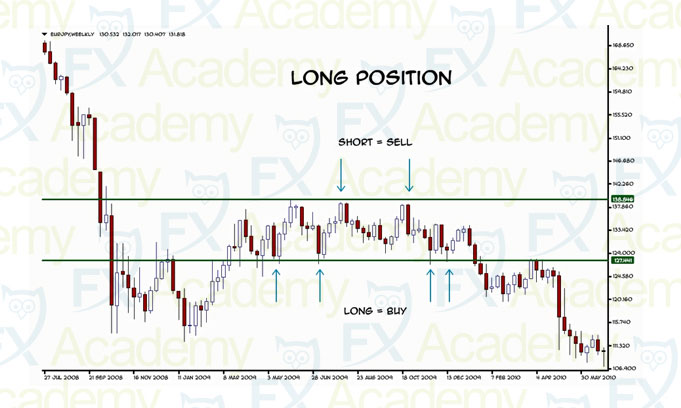
In our lesson on long and short trades, we will review the concepts of long and short positions, and how to use them to enter and exit a trade profitably.
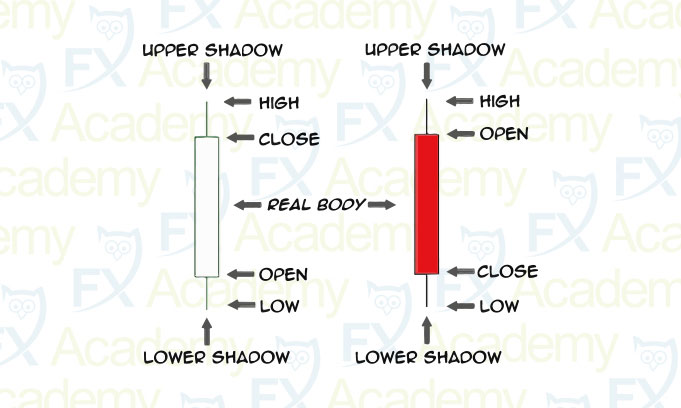
This course will also include a further lesson on reading Japanese candlesticks and what the candle shapes and wicks on these charts can tell the Forex trader about market sentiment.
Advanced Support and Resistance & Trend Lines in Forex
Now you understand some basics about candle charts , you are ready to get to the heart of Technical Analysis and learn the tools required to identify the likely S/R areas at which to enter or open a position and the likely S/R zone at which to best exit or close it.
The first lesson in this course reviews price levels and areas where trends tend to start, pause, or reverse. We will show you how price levels are really narrow price bands or ranges, rather than specific prices, and how to find these on the charts. We will then discuss single trend lines and review up, down, and flat single trend lines.
You will then learn about channels, which are parallel trend lines that surround a rising or falling trend, and what the shape and angle of each channel can tell us regarding the price range. We will show how higher highs and higher lows define an uptrend and lower highs and lower lows define a downtrend.
Like simple trend lines and channels, moving averages (or MAs) are another kind of trend line that helps clarify the trend because they smooth out the gyrations of individual price or candle movements. We will examine the advantages of MA’s over simple trend lines and channels and their variations.
The final type of trend lines are Bollinger Bands. We show how these can combine the traits of both channels and simple moving averages (SMAs), giving us an indication of both S/R and momentum.

Fibonacci Retracement Levels
In this course, we will explain Fibonacci Retracements (“fibs”), a totally different support/resistance indicator. Fibs are based on certain mathematical relationships, expressed as ratios, between numbers in a series. Their discovery was popularized by the thirteenth-century mathematician Leonardo Fibonacci. They have applications in fields as diverse as biology, music, art, and architecture.
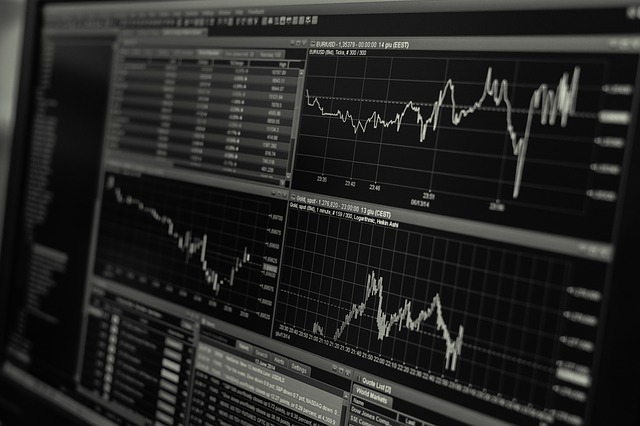
Here we focus on what’s relevant to trading and show you the Fibonacci formula in Forex trading. As in any financial market, Forex prices don’t move straight up or down. Instead, they zigzag within their overall longer term trends or ranges, as the market tests recent short term support and resistance. We will review why it is important to study multiple time frames before placing a trade, and how to examine them on a chart.
The simulataneous analysis of multiple time frames helps you can gain a better understanding of what fibs are really measuring and how the price is really behaving.
Moving Average Crossovers & Momentum
Forex technical analysis encompasses the use of some of a range of indicators, including momentum indicators. In this course, we will learn how moving averages can be adapted to serve as momentum indicators, as well as marking mobile support and resistance. With Forex technical analysis, we can plot multiple moving averages of different time spans on our charts, and can create a hybrid momentum indicator, the moving average crossover. We will review the two types of moving average crossovers.
The first type of moving average crossover is price crossing over or under a moving average. The second type of moving average crossover is a shorter-duration moving average crossing over a longer, slower moving averags.
Using Forex technical analysis, we will learn under what conditions a moving average crossover signals a possible momentum and trend change.
Finally, we will talk about Momentum Indicators. These are used by Forex traders, usually to resolve certain kinds of common trader dilemmas that other support/resistance indicators can’t answer. They also give traders a better idea of future price movements.
All these indicators are good for lagging indicators trading, meaning that these indicators only give you a signal after something has happened, and not before it. Despite the delay, they can still be predictive enough to be useful to Forex traders.
Risk Management
When you begin your journey as a trader, you are putting your hard-earned capital at risk.
Often, the last thing a new trader thinks about is how to manage risk. Instead, they are thinking about getting perfect entries or how many trades they can find in a day. And very often they are thinking about how to spend their profits!
But managing risk should be the first item on a trader’s To-Do list. Ask any successful trader about their trading and they will speak about how they manage risk to achieve their goals. The head of the largest hedge fund in the world, Ray Dalio, writes in his book, “If you are not defensive, you are not going to keep money.”
Risk management is the foundation to successful trading. We at Forex Aspire want you to learn that through these lessons and not learn it by losing a big part of your trading account!
What does it mean to manage risk? How do we do it? This module gives you a solid risk-management plan in easy to digest lessons.
Lesson 1 talks about the top three things you can do to control risk to be profitable and consistent.
Lesson 2 focuses on “Risk Capital”. What do you need to do to be sure you are trading with money that is truly Risk Capital? Find out in Lesson 2!
Lesson 3 is all about controlling the size of your trades, so you are risking a pre-defined percentage of your account for every trade. This is called “Position Sizing”. And Forex Aspire has an easy way to calculate this for you. Find out where in Lesson 3!
Lesson 4 looks at how to measure your profits and when to take them. We introduce the concept of the “Risk/Reward Ratio”. This concept should be behind every trade you place.
Risk Disclaimer
TRADING IS NOT SUITABLE FOR EVERYONE.
IF YOU DON’T KNOW WHAT YOU’RE DOING, TRADING FOREX AND CRYPTO CAN CAUSE YOU TO COMPLETELY LOSE ALL OF YOUR MONEY.
FOREX AND CRYPTO TRADING IS HIGHLY SPECULATIVE AND RISKY.
IT IS ONLY SUITABLE FOR THOSE PEOPLE WHO UNDERSTAND, AND ARE WILLING TO TAKE ON, THE FINANCIAL AND OTHER RISKS INVOLVED, AND WHO HAVE THE RESOURCES TO WITHSTAND LOSSES THAT MAY BE SIGNIFICANTLY GREATER THAT ANY DEPOSITS YOU HAVE MADE.
Financial instruments that are traded on leverage carry a high level of risk and you could lose more than your deposits.
Trading on a leveraged basis means a small market movement will have a proportionally larger impact on your position and could result in a total loss of your deposit(s).
The high leverage associated with trading foreign currency can result in significant losses due to price changes, especially during periods of volatility in the underlying market.
Please ensure you fully understand the risks and carefully consider your financial situation and trading experience before trading.
Trading forex or cryptocurrencies on margin carries a HIGH LEVEL OF RISK, and may not be suitable for all investors. Before participating in the FX and crypto markets, you should carefully consider your investment objectives, level of experience, and risk appetite.
You should trade in foreign currency contracts or cryptocurrencies only if you understand the contracts (and contractual relationships) into which you are entering and the extent of your exposure to risk.
The possibility exists that you could sustain a loss of some or all of your initial investment and therefore you should not invest money that you cannot afford to lose!
The high degree of leverage associated with trading currencies means that the degree of risk compared to other financial products is higher.
The leveraged nature of forex and crypto trading means that any market movement will have an equally proportional effect on your deposited funds.
Leverage (or margin trading) may work against you resulting in substantial loss. And a feeling a sensation similar to getting sucker-punched in the stomach. And then in the face. And then in the throat.
There is considerable exposure to risk in any off-exchange foreign exchange transaction, including, but not limited to, leverage, creditworthiness, limited regulatory protection, and market volatility that may substantially affect the price or liquidity of a currency or currency pair.
You should be aware of all the risks associated with forex and crypto trading
Seek advice from an independent financial advisor if you have any doubts.